Office space utilization measurement has always been difficult, and interpreting the data, especially while adjusting for changing workplace behaviors, can be quite challenging.
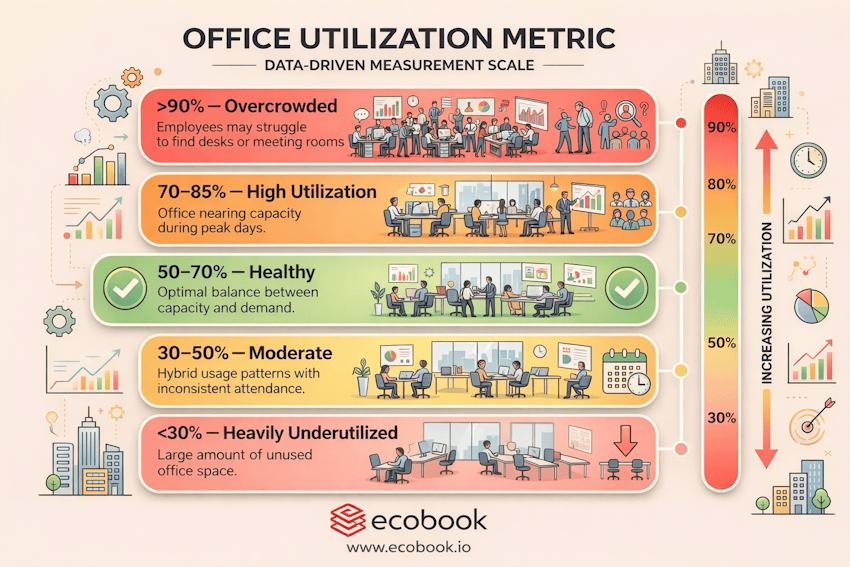
Here is a simple infographic that helps provide perspective on the different utilization percentages and what they may indicate about office usage.
🔴 <𝟯𝟬% 𝗛𝗘𝗔𝗩𝗜𝗟𝗬 𝗨𝗡𝗗𝗘𝗥𝗨𝗧𝗜𝗟𝗜𝗭𝗘𝗗
𝘓𝘢𝘳𝘨𝘦 𝘢𝘮𝘰𝘶𝘯𝘵𝘴 𝘰𝘧 𝘶𝘯𝘶𝘴𝘦𝘥 𝘸𝘰𝘳𝘬𝘴𝘱𝘢𝘤𝘦.
This is usually caused by poorly designed hybrid and weak RTO policies where employees do not see any incentive to come to office. Poorly designed office spaces that do not reflect the reality of work or employee expectations. The nature of the business also reflects on the utilization where most of the work is done online and can be done from anywhere. Another reason can be an over commitment of space compared to the actual need.
This provides an opportunity to reduce space, re-purpose the existing space, redesign the workplace layout, or revisit hybrid/RTO work policies.
🟡 𝟯𝟬–𝟱𝟬% 𝗠𝗢𝗗𝗘𝗥𝗔𝗧𝗘 𝗨𝗧𝗜𝗟𝗜𝗭𝗔𝗧𝗜𝗢𝗡
𝘖𝘧𝘧𝘪𝘤𝘦 𝘶𝘴𝘦𝘥 𝘪𝘯𝘤𝘰𝘯𝘴𝘪𝘴𝘵𝘦𝘯𝘵𝘭𝘺.
Hybrid work patterns, where employees come in only on certain days of the week. Teams may not be coordinating office days, leading to uneven demand across the week. Workspace mix may not match actual needs (e.g., too many desks, not enough collaboration areas).
This provides an opportunity to improve visibility of office usage, encourage team-based office days, and gradually rebalance workspace types to better support collaboration and shared work.
🟢 𝟱𝟬–𝟳𝟬% 𝗛𝗘𝗔𝗟𝗧𝗛𝗬 𝗨𝗧𝗜𝗟𝗜𝗭𝗔𝗧𝗜𝗢𝗡
𝘖𝘱𝘵𝘪𝘮𝘢𝘭 𝘣𝘢𝘭𝘢𝘯𝘤𝘦 𝘰𝘧 𝘤𝘢𝘱𝘢𝘤𝘪𝘵𝘺 𝘢𝘯𝘥 𝘶𝘴𝘢𝘨𝘦.
This is the typical target range for hybrid workplaces with a healthy mix of utilization and availability for variations. There is enough capacity to support peak demand while still maintaining flexibility. Employees can generally find desks and meeting spaces without friction.
According to CBRE, this is close to the target utilization of 65%.
This provides an opportunity to maintain this balance by continuously monitoring trends, adjusting workspace allocation over time, and ensuring the right mix of desks, collaboration spaces, and meeting rooms.
🟠 𝟳𝟬–𝟴𝟱% 𝗛𝗜𝗚𝗛 𝗨𝗧𝗜𝗟𝗜𝗭𝗔𝗧𝗜𝗢𝗡
𝘖𝘧𝘧𝘪𝘤𝘦 𝘯𝘦𝘢𝘳𝘪𝘯𝘨 𝘤𝘢𝘱𝘢𝘤𝘪𝘵𝘺 𝘥𝘶𝘳𝘪𝘯𝘨 𝘱𝘦𝘢𝘬 𝘩𝘰𝘶𝘳𝘴.
Certain days (often Tue–Thu) may experience heavy demand. Meeting rooms and collaboration spaces may be fully booked. Desk availability may become limited during peak periods. This could cause potential frustration in finding suitable spaces to work.
This provides an opportunity to introduce desk reservation or room booking systems to schedule spaces in advance, optimize workspace layouts, add flexible collaboration areas, and implement occupancy sensors to closely monitor peak-day patterns to prevent bottlenecks.
🔴 >𝟵𝟬% 𝗢𝗩𝗘𝗥𝗖𝗥𝗢𝗪𝗗𝗜𝗡𝗚
𝘞𝘰𝘳𝘬𝘴𝘱𝘢𝘤𝘦 𝘥𝘦𝘮𝘢𝘯𝘥 𝘦𝘹𝘤𝘦𝘦𝘥𝘴 𝘤𝘢𝘱𝘢𝘤𝘪𝘵𝘺.
Employees may struggle to find desks or meeting rooms. Informal collaboration spaces may become overloaded. Productivity and employee experience may decline due to overcrowding. Frustration in not being able to find spaces can lead to decreased motivation to come to office and miss opportunities for in-person collaboration.
This provides an opportunity to reconfigure office layouts, introduce flexible seating policies, increase shared workspaces, or consider expanding capacity where demand consistently exceeds supply.
Concluding
Understanding utilization is not just about numbers. It’s about aligning 𝘄𝗼𝗿𝗸𝘀𝗽𝗮𝗰𝗲 𝗱𝗲𝘀𝗶𝗴𝗻, 𝗵𝘆𝗯𝗿𝗶𝗱 𝘄𝗼𝗿𝗸 𝗽𝗼𝗹𝗶𝗰𝗶𝗲𝘀, 𝗮𝗻𝗱 𝗲𝗺𝗽𝗹𝗼𝘆𝗲𝗲 𝗯𝗲𝗵𝗮𝘃𝗶𝗼𝗿.
The goal isn’t necessarily 100% utilization. It is 𝘁𝗵𝗲 𝗿𝗶𝗴𝗵𝘁 𝗯𝗮𝗹𝗮𝗻𝗰𝗲 𝗯𝗲𝘁𝘄𝗲𝗲𝗻 𝗲𝗳𝗳𝗶𝗰𝗶𝗲𝗻𝗰𝘆, 𝗳𝗹𝗲𝘅𝗶𝗯𝗶𝗹𝗶𝘁𝘆, 𝗮𝗻𝗱 𝗲𝗺𝗽𝗹𝗼𝘆𝗲𝗲 𝗲𝘅𝗽𝗲𝗿𝗶𝗲𝗻𝗰𝗲.